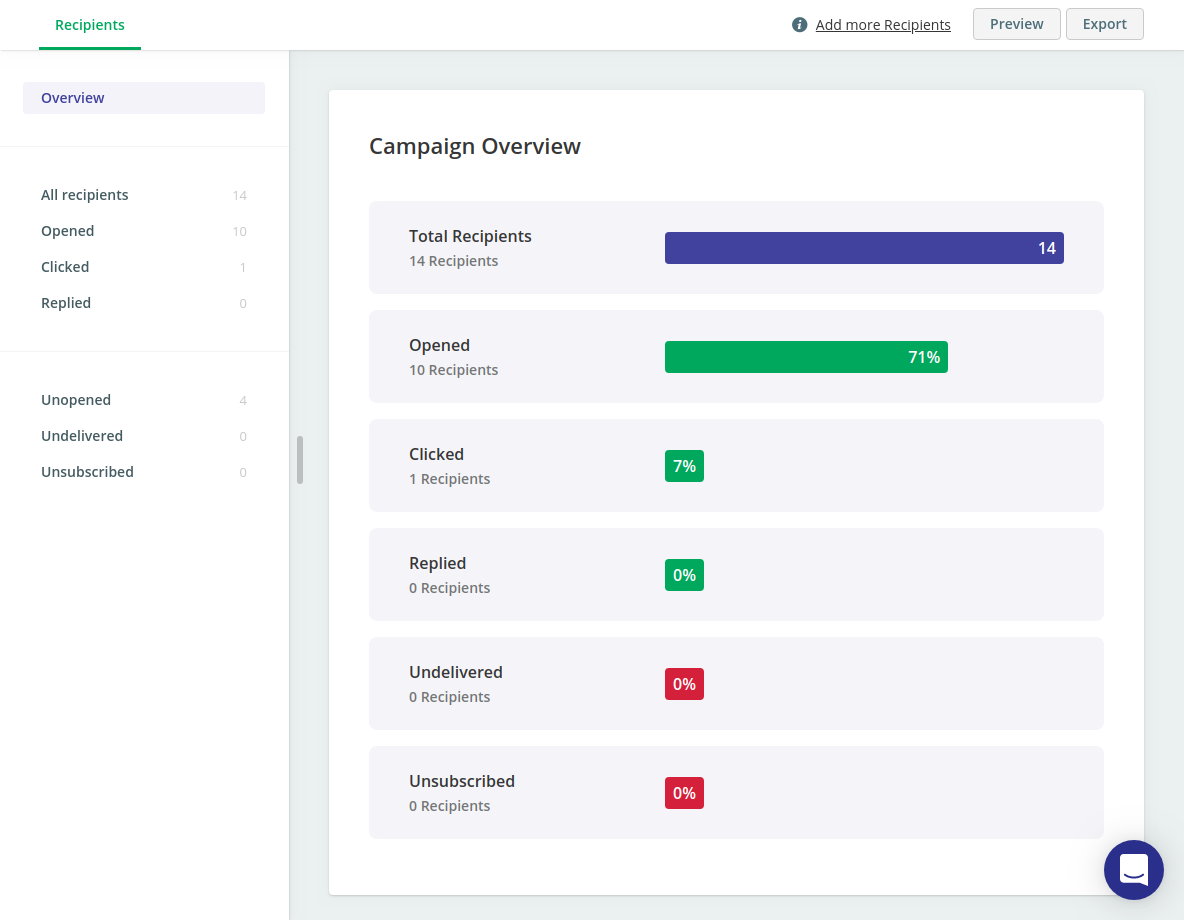
Campaign stats (in %) and improved report
On the campaign report you will now find a visual overview of the performance of your campaign.
.png)
In addition we have replaced the performance columns in contact and campaign grids by % allowing you to find your best or worst performing campaigns. Moving your mouse over a column shows the absolute numbers.